下载
kaggle competitions download -c titanic
unzip ./titanic.zip -d ./titanic
import pandas as pd
import matplotlib.pyplot as plt

df = pd.read_csv('./titanic/train.csv')

df_temp = df[['Embarked', 'Survived']]

# 生成数据透视表
## 方法1
table = pd.pivot_table(df_temp, index=['Embarked'], columns=['Survived'], aggfunc=len)
table = pd.pivot_table(df, index=['Embarked'], columns=['Survived'], aggfunc=len)

## 方法2 数据交叉表
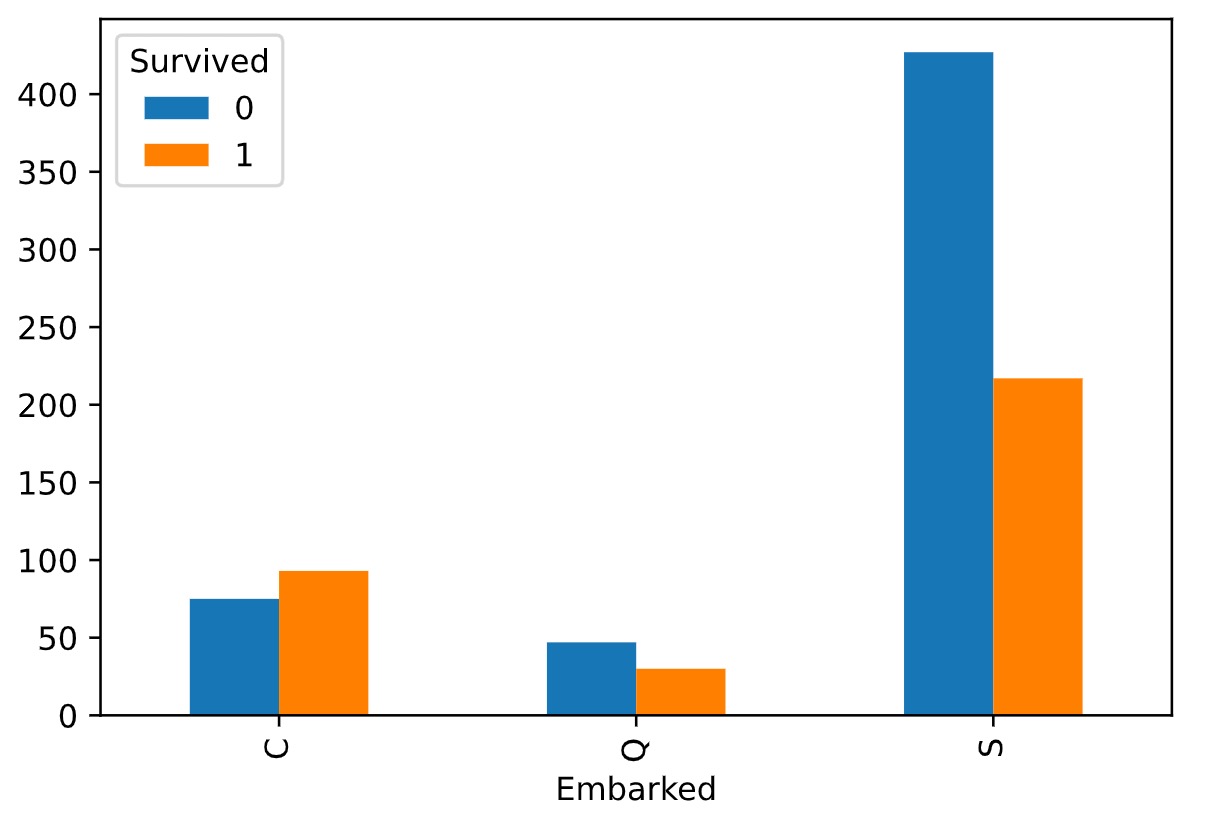
table = pd.crosstab(df.Embarked, df.Survived)

# 画图
table.plot(kind='bar')
plt.show()
